You could make life-changing investment decisions if you looked at stock charts for more than a few seconds.
The stock chart of a public company is its heartbeat telling you how the company is doing. You can find potential multibaggers just by looking at how the price is moving.
Once you understand this idea, investing feels like a video game and you have the cheat codes.
Apple sucked after the dotcom crash. The stock plummeted and went nowhere for three years. Then in 2004 it started to rise.
Steve Jobs was back at the company. He was a mature CEO and a visionary.
The iPod was a hit. But the real hit was the iPhone that came out in 2007.
Apple stock was showing strength exactly at that time. Professional traders would say
“Apple stock completed a long-term bottom.”
The stock broke through the 2000 high and started making new all-time highs.
The chart couldn’t tell you that Apple had come up with the iPod and the iPhone. But the chart made it clear the company was re-inventing and the new products were already making it serious money.
That was the time to invest in Apple.
Not on a dip (there are many dips).
Not at the all-time low (you couldn’t know it was an all-time low).
Not on a random day when Apple seemed poised for growth (too subjective).
You invest in a company when its price and fundamentals align and signal long-term growth ahead. That was Apple after 2005.
Here’s a more recent stock chart. The company is Applovin, a technology company for app growth and monetization.
Could you tell its stock chart looked promising (without knowing what the company does) before it skyrocketed?
Hell yeah.
1. It completed its IPO bottom. The price broke through the IPO price and stayed there (sign of profitability).
2. The chart shows sideways trends with well-defined highs and lows (sign of institutional investors).
3. Individual candlesticks in price runs are mostly white and neat (sign of professional traders).
A chart like this should light a fire under your a$$ to dive into the fundamentals. Applovin is a mega-successful company.
Revenue up 42% YoY
Long-term debt $3,5 billion
Free cash flow $826 million
Rising earnings
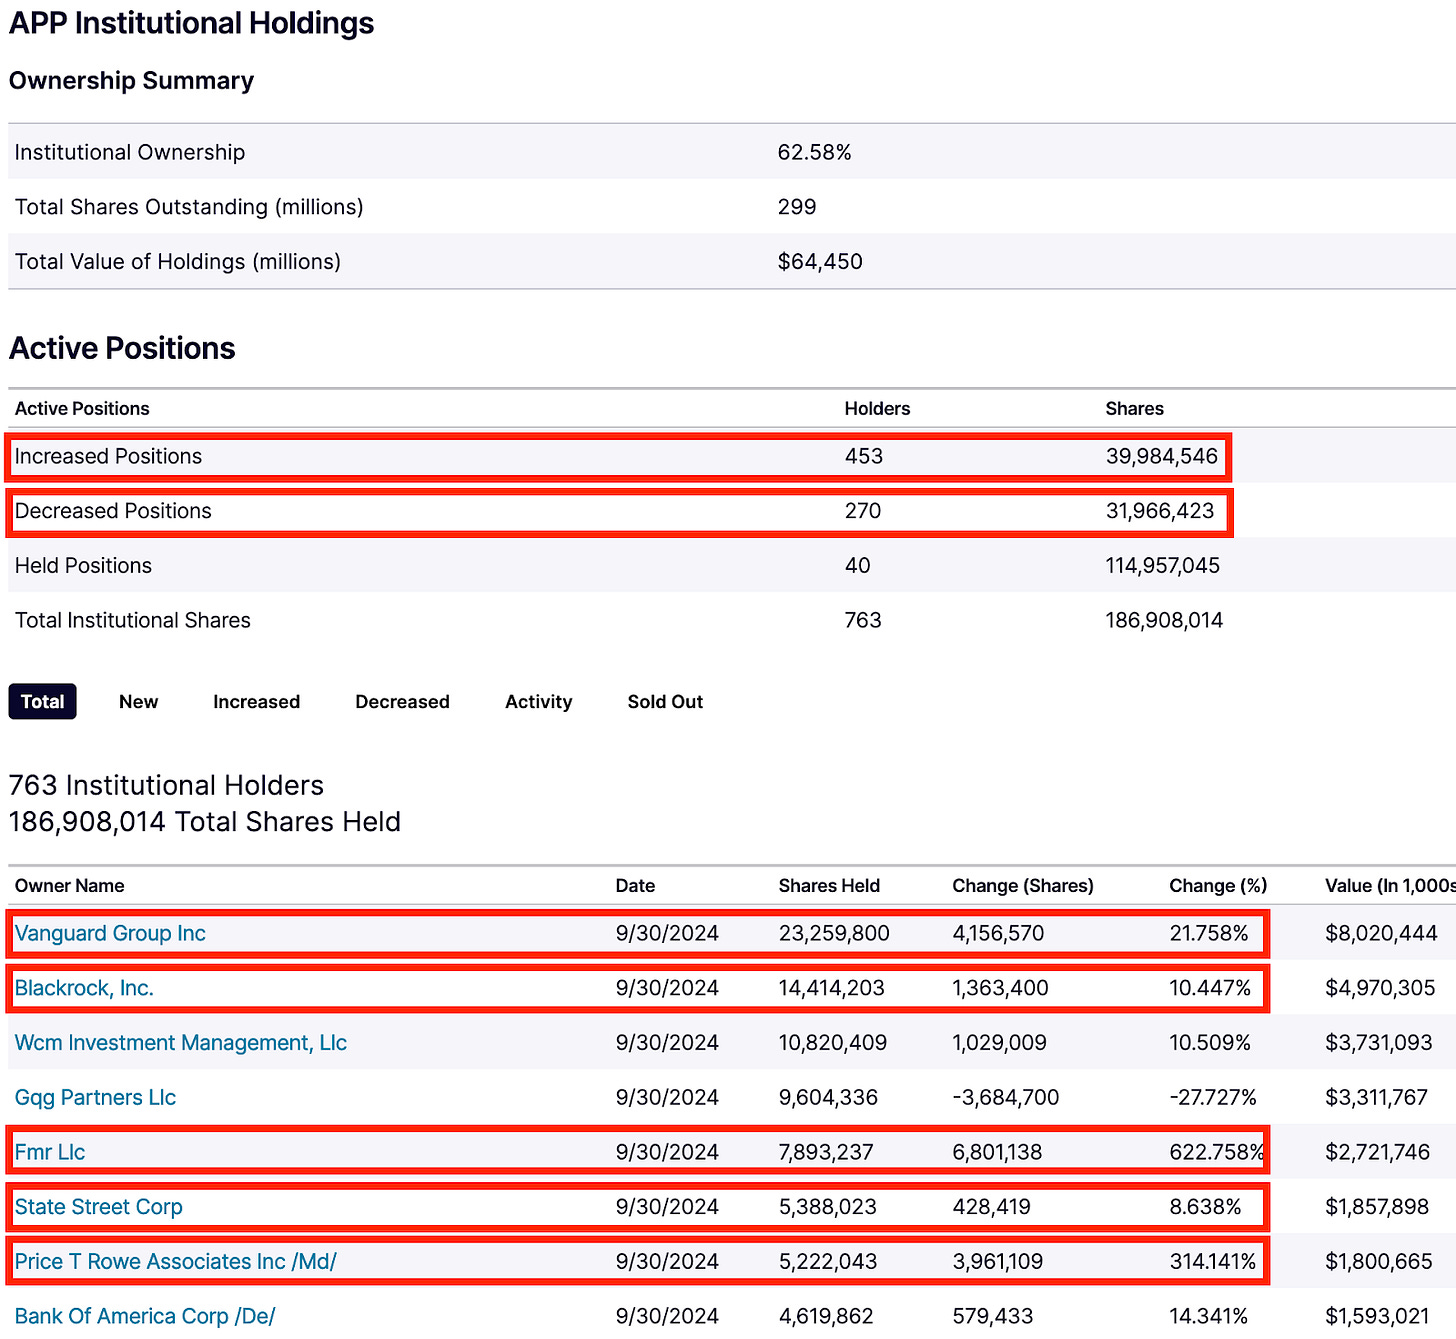
And here’s what institutional investors were doing with APP stock.

By September 30, 2024 the largest asset management companies in the world loaded up on the stock. They knew it was a screaming buy. You knew it was a screaming buy.
It soared by 300% after September 30, 2024 by to its all-time high of $517.
Now Applovin’s growth has slowed down. Its earnings have flattened out. The market overshot with speculation in February 2025.
APP stock is correcting. If it finds a way to boost its growth like Apple did two decades ago, it’ll go beyond the all-time high.
Look for other opportunities.
Some stock charts hit you like a brick and freeze you dead in your tracks. And you only need a few minutes to spot unusual price dynamics.
Good fundamentals lead to specific price action. But you need to reverse engineer the process because you can’t do deep dives into each one of the 5,000 public companies traded on the US stock exchanges.
You look at their stock charts first and single out the best candidates.
Then you do fundamental analysis for a small number of companies.
If the improving fundamentals justify the rising price, you invest in the company.
Begin analyzing public companies by studying their stock charts. It’s faster because if you learn this skill, it takes you a few seconds to tell a weak stock from a stock with growth potential.
This doesn’t mean you can interpret any stock chart. Investing comes down to finding every reason *not* to buy a stock.
I can understand 20% of all the stock charts I look at. They turn into a mess when there’s too much emotional trading like when people buy and sell them on their phones on the same day.
That’s when I stay away. Popular retail stocks often scream trouble.
20% is still more than enough to make good investment decisions.
Analysis of stock charts is a tool that tells you who’s interested in your target company - retail (emotional) or professional (objective) investors?
You should invest with the savviest market participant group. The probability of making the right choice is higher.
So don’t just memorize what your target stock was worth yesterday. Keep an eye on its price patterns.
Studying stock charts is the first step to adding a zero to your investment account.
This article is for informational purposes only. It should not be considered Financial or Legal Advice. Not all information will be accurate. Consult a financial professional before making any major financial decisions.
P. S. A big announcement is coming in two days. I’m excited to roll out a framework that helps investors find high-growth public companies before everyone begins to speak about them. Keep an eye on your inbox.


Wow! I understood almost everything you said. But what is a multibagger?